🚛 Full Truckload Quote: What Shippers Must Know in 2026
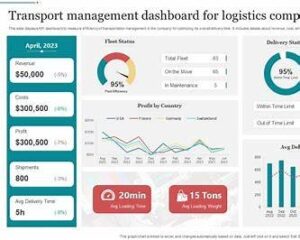
In today’s freight marketplace, securing the right Full Truckload Quote isn’t just about price — it’s about understanding capacity, demand trends, and regional market conditions. Tools like DAT iQ Market Conditions provide a view of dry van demand vs available trucks that help shippers anticipate pricing and capacity tightness.
📊 What Is Truckload Capacity?
Truckload capacity refers to the number of available trucks (typically dry van trailers) relative to load demand. Freight analytics platforms — including heat map and load-to-truck ratio tools — show which states have “tight” (more demand than trucks) or “loose” (plenty of trucks) markets.
When capacity tightens (higher loads per truck), rates typically go up — impacting your Full Truckload Quote. Conversely, when capacity is abundant, shippers have more negotiating power.
📌 Key Market Dynamics Impacting Your Quote
📍 Regional Capacity Differences
While specific live charts require login, here’s what trends tell us:
- California & Texas often show high dry van demand due to large ports and manufacturing hubs — affecting capacity and quotes on major lanes.
- New York & Northeast corridors are highly trafficked but also tend to see volatility due to congestion pricing and city delivery restrictions.
- Florida & Southeast markets peak seasonally — especially in produce season — leading to tighter capacity.
States with key freight flows — like CA, TX, NY, and IL — drive many full truckload lanes, so understanding local supply vs demand helps you budget and plan.
📈 Load-to-Truck Ratio is Your Indicator
A load-to-truck ratio tells you how many loads are posted for every truck. Higher ratios mean carriers are busier and you’ll likely see higher Full Truckload Quotes. Market tools like those from DAT iQ visualize this for every state so you can plan ahead.
🤝 Asset-Based Carrier vs Freight Broker: Pros & Cons
🚚 Asset-Based Carrier (Your Own Trucks or Direct Carrier)
Advantages
- Higher control over performance and timelines
- Direct relationship with drivers and equipment
- Often more reliable capacity on committed lanes
Disadvantages
- Can be more expensive when capacity is tight
- Operational costs (fuel, drivers, maintenance) are passed to shippers
- Less flexibility for sporadic shipping needs
📦 Freight Brokers
Advantages
- Flexibility — brokers can tap multiple carriers for space
- Often competitive pricing
- Great for variable freight volumes and one-off lanes
Disadvantages
- Less direct control over execution
- Multiple carrier rates/services can vary
👍 At MO Trucking Inc., we operate both asset-based carrier services and a freight brokerage division, giving shippers tailored flexibility and competitive Full Truckload Quotes based on real market capacity.
🧠 FAQ — Full Truckload Quotes & Capacity
Q: What affects my Full Truckload Quote the most?
A: Truckload capacity, load demand in your lanes, seasonality, and regional trends like port throughput or agricultural shipping spikes all influence your quote. Tools such as DAT iQ’s Market Conditions help anticipate these shifts.
Q: Why does a route from California cost more than the Midwest?
A: California’s freight volumes — particularly inbound from major ports like LA/Long Beach — drive demand for trucks. When demand outpaces truck availability, rates and therefore your quote rise.
Q: Can I get instant Full Truckload Quotes?
A: Yes — online rate calculators, like those found on platforms such as Freightquote®, can provide instant dry van rates to help compare options.
Q: When is the best time to lock in a truckload rate?
A: Early in the week and ahead of seasonal peaks often gives better pricing before capacity tightens.
Q: How do shippers reduce costs?
A: Consolidating shipments, using flexible lanes, or leveraging both contract and spot market capacity helps lower quotes over time.
📍 Long-Tail Keywords & Top Regions We Recommend Targeting
- “Full Truckload Quote California to New Jersey dry van”
- “Texas freight capacity trends truckload pricing”
- “Full Truckload Quote from Los Angeles to Chicago”
- “Florida seasonal truckload pricing heat map”
- “U.S. truckload capacity by state for shippers”
These help capture regional intent from shippers searching for precise freight pricing and capacity insights.
📌 Final Thoughts: Market Intelligence + Smart Shipping
Understanding capacity and pricing trends — especially with tools like DAT iQ Market Conditions and load-to-truck ratios — empowers your freight decisions. Whether you’re quoting lanes from California ports or shipping statewide from Texas or New York, market insights shape better Full Truckload Quotes.
Let MO Trucking Inc. help you navigate these conditions with our dual-division freight solutions — connecting you to the right capacity at the right price.
📎 Sources
- DAT iQ Market Condition insights and dry van load-to-truck ratio basics.
- Regional capacity and spot trends from freight market overviews.
- Truckload services & quote examples.