🚛 2025 SHIPPER GUIDE: HOW SUPPLY & DEMAND INFLUENCE TRUCKLOAD FREIGHT CHARGESAND WHAT SMART SHIPPERS SHOULD KNOW
________________________________________
📦 Why Understanding Truckload Freight Charges in 2025 Matters
As the U.S. freight industry surges through 2025, market conditions remain cyclical — driven by economic output, labor availability, fuel price trends, seasonal shipping patterns, and evolving retail demands. For shippers managing national supply chains or overseeing regional freight deliveries, knowing how Truckload Freight Charges are set is vital to keep your transportation budgets lean and your delivery schedules on track.
Whether you’re looking for a Full Truckload Shipping Quote, a reliable Truckload Freight Provider, or want to better understand what factors drive Truckload Shipping Rates, this guide unpacks it all.
________________________________________
✨ Introduction: The Freight Rate Cycle Explained
The truckload freight market naturally rises and falls in pricing based on classic supply and demand dynamics. When shipping demand exceeds truck availability, freight rates climb. When capacity is abundant and loads are scarce, rates fall.
In recent years, global trade disruptions, e-commerce growth, labor shortages, and stricter green fuel mandates have made these fluctuations sharper and less predictable than ever.
In this shipper guide, we’ll cover:
- How Truckload Freight Charges are calculated in 2025
- Key market factors behind freight rate swings
- How supply chain trends influence pricing behavior
- How to secure better truckload shipping rates and avoid capacity pitfalls
________________________________________
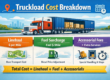
📊 How Truckload Freight Charges Are Determined
Data from FreightWaves confirms that Truckload Freight Charges hinge on several variables:
- Available capacity vs. shipping demand
- Fuel costs
- Accessorial fees like detention, layovers, and liftgate services
- Market premiums during tight capacity windows
- Seasonal pricing adjustments
Modern freight rate calculators and digital broker platforms like Loadsmart and DAT One now use AI-driven algorithms to quote rates instantly. These platforms consider factors like pickup and delivery locations, freight weight, trailer type (dry van, reefer, flatbed), and fuel surcharges — all in real time.
________________________________________
🚀 Why Accurate Rate Forecasting Matters
Failing to predict freight rate increases can lead to:
- Budget overruns
- Late deliveries
- Inventory shortages
- Strained carrier relationships
Smart shippers hedge against these issues by blending contract truckload rates with spot market quotes when capacity loosens. Project44 suggests combining both strategies to manage rate volatility effectively.
________________________________________
📈 2025 U.S. Truckload Market Outlook
The U.S. truckload freight market is forecasted to top $890 billion in revenue this year, according to FTR Transportation Intelligence. Capacity shortages, driver attrition, and shifting demand from retail, foodservice, and construction are driving rate spikes across major freight corridors.
Popular search terms your competitors are using:
- Truckload Carrier Near Me
- FTL Freight Quote
- Truckload Freight Rates 2025
- Best Truckload Freight Companies
- Truckload Shipping Cost Calculator
- Affordable FTL Freight Rates
Be where your customers are searching.
________________________________________
📊 Supply & Demand Dynamics Behind Rate Swings
Truckload Freight Charges fluctuate because of:
- Seasonal shipping cycles (produce season, back-to-school, retail holidays)
- Diesel price volatility (up 8% YoY — U.S. EIA Q2 2025)
- Weather events limiting capacity in certain markets
- Ongoing driver shortages (ATA reports a 65,000-driver shortfall)
- Trade policy changes disrupting import/export flows
When shipping demand surges beyond available capacity, freight rates spike. When trucks outpace shipping demand, rates drop.
________________________________________
📦 How Tariffs, Green Regulations & Retail Trends Impact Charges
New tariffs on imports like steel and lumber have spiked domestic manufacturing and regional truckload shipments. Simultaneously, green fuel mandates and emissions regulations have added fuel surcharges and eco-fees on certain lanes.
Flexport’s latest report shows expedited domestic truckload freight to replace delayed imports has caused premium rates on high-demand lanes like Los Angeles → Dallas and Chicago → Atlanta.
________________________________________
📝 How to Instantly Check Truckload Freight Charges
Need fast, reliable pricing? Enter:
- Pickup & delivery ZIP codes
- Freight type, weight, and dimensions
- Trailer type (dry van, reefer, flatbed, or specialized equipment)
Top tools for instant Truckload Freight Quotes:
- Truckstop.com
- DAT One
- Loadsmart
- Your 3PL’s Transportation Management System (TMS)
Compare rates, check market capacity, and book capacity in minutes.
________________________________________
📍 Seasonal & Regional Pricing Hot Spots
Know when and where rates spike:
- July–August: Produce season in Southeast (reefer rates up 25–30%)
- November–December: Holiday e-commerce tightening dry van capacity
- February: Post-Chinese New Year import volumes impact West Coast lanes
________________________________________
⚖️ Freight Broker vs. Direct Carrier Pricing: Which is Best for You?
| Feature | Freight Broker | Direct Carrier |
| Nationwide capacity access | ✅ | ❌ |
| Market-driven rate flexibility | ✅ | Varies |
| Digital rate quoting tools | ✅ | Sometimes |
| Extra capacity during surges | ✅ | Limited |
Per C.H. Robinson, brokered truckload freight shipments can cut costs by 18–23% in tight markets thanks to broader carrier access and flexible spot rate optimization.
________________________________________
🔮 2025 Trends Changing the Truckload Market
- AI-driven pricing tools for precise, real-time rate quotes
- E-commerce’s continued demand surge for regional truckload services
- Autonomous vehicle pilot programs easing long-haul driver pressure
- Green fuel mandates adding costs for long-haul heavy-haul freight
- Uber Freight forecasts accelerated digital brokerage growth, shrinking negotiation timelines and improving freight rate forecasting
________________________________________
📦 Key Shipper Search Terms You Should Know
For maximum visibility in Google searches, here are the most-searched phrases for 2025:
- Truckload Freight Rates 2025
- FTL Freight Quote
- Truckload Carrier Near Me
- Instant Truckload Shipping Quote
- Dry Van Trucking Rates
- Flatbed Freight Services
- Best Full Truckload Shipping Company
- Truckload Shipping Estimate Calculator
- Regional Truckload Providers
- Affordable Truckload Freight Rates
- Freight Market Rate Trends 2025
Use them in your logistics strategy, online freight bids, and rate comparison tools.
________________________________________
🚛 Final Thought
The truckload market’s cyclical rate fluctuations are here to stay. But with smart forecasting tools, careful market monitoring, and strategic blending of contract and spot truckload rates, shippers can stay agile, avoid capacity pitfalls, and secure the most competitive Truckload Freight Charges in 2025.
________________________________________
🚛 Estimated Truckload Freight Rates Per Mile from Florida to U.S. Regions
| Destination Region | Estimated Rate per Mile | Notes |
| Southeast (e.g., Georgia, Alabama) | $2.00 – $2.50 | Short-haul routes with high demand. |
| Northeast (e.g., New York, Massachusetts) | $2.50 – $3.00 | Longer distances with dense urban deliveries. |
| Midwest (e.g., Illinois, Ohio) | $2.30 – $2.80 | Central locations with varied demand. |
| Southwest (e.g., Texas, Arizona) | $2.40 – $2.90 | Long-haul routes with moderate demand. |
| West (e.g., California, Washington) | $2.70 – $3.20 | Longest distances with higher fuel costs. |
| Northwest (e.g., Oregon, Idaho) | $2.80 – $3.30 | Remote areas with limited backhaul opportunities. |
| Alaska | $3.50 – $4.50 | Includes additional costs for ferry or air transport. |
| Hawaii | $4.00 – $5.00 | Requires ocean freight; rates vary significantly. |
🚛 Estimated Truckload Freight Rates Per Mile from Texas to U.S. Regions (2025)
| Destination Region | Estimated Rate per Mile | Notes |
| Southeast (e.g., Florida, Georgia, Alabama) | $2.10 – $2.60 | Steady high-volume lanes with regular freight demand. |
| Northeast (e.g., New York, Massachusetts, Pennsylvania) | $2.60 – $3.20 | Longer hauls with tolls, congestion, and higher fuel surcharges. |
| Midwest (e.g., Illinois, Ohio, Indiana) | $2.30 – $2.85 | Balanced demand with consistent manufacturing and retail freight. |
| Southwest (e.g., Arizona, New Mexico) | $2.00 – $2.50 | Intra-regional hauls with reliable backhaul opportunities. |
| West (e.g., California, Nevada, Washington) | $2.70 – $3.30 | Long-haul lanes with high fuel costs and California-specific regulations. |
| Northwest (e.g., Oregon, Idaho, Montana) | $2.90 – $3.40 | Remote regions with limited capacity and higher linehaul rates. |
| Alaska | $3.60 – $4.70 | Requires ferry or intermodal services, with limited capacity. |
| Hawaii | $4.20 – $5.20 | Ocean container freight rates vary significantly based on volume. |
🚛 Estimated Truckload Freight Rates Per Mile from South Carolina to U.S. Regions (2025)
| Destination Region | Estimated Rate per Mile | Notes |
| Southeast (e.g., Georgia, Florida, Alabama) | $2.10 – $2.60 | High-volume lanes with consistent demand. |
| Northeast (e.g., New York, Massachusetts, Pennsylvania) | $2.60 – $3.20 | Longer hauls with urban delivery complexities. |
| Midwest (e.g., Illinois, Ohio, Indiana) | $2.30 – $2.85 | Balanced demand with manufacturing freight. |
| Southwest (e.g., Texas, Arizona) | $2.40 – $2.90 | Long-haul routes with moderate demand. |
| West (e.g., California, Nevada, Washington) | $2.70 – $3.30 | Extended distances with higher fuel costs. |
| Northwest (e.g., Oregon, Idaho, Montana) | $2.90 – $3.40 | Remote areas with limited backhaul opportunities. |
| Alaska | $3.60 – $4.70 | Includes additional costs for ferry or air transport. |
| Hawaii | $4.20 – $5.20 | Requires ocean freight; rates vary significantly. |
🚛 Estimated Truckload Freight Rates Per Mile from Nevada to U.S. Regions (2025)
| Destination Region | Estimated Rate per Mile | Notes |
| Southeast (e.g., Florida, Georgia, Alabama) | $2.50 – $3.10 | Long-haul routes with limited backhaul opportunities. |
| Northeast (e.g., New York, Massachusetts, Pennsylvania) | $2.70 – $3.30 | Extended distances with urban delivery complexities. |
| Midwest (e.g., Illinois, Ohio, Indiana) | $2.40 – $2.90 | Balanced demand with manufacturing freight. |
| Southwest (e.g., Arizona, New Mexico) | $2.00 – $2.50 | Short-haul routes with consistent demand. |
| West (e.g., California, Oregon, Washington) | $2.10 – $2.60 | Regional hauls with moderate demand. |
| Northwest (e.g., Idaho, Montana) | $2.30 – $2.80 | Remote areas with limited backhaul opportunities. |
| Alaska | $3.60 – $4.70 | Includes additional costs for ferry or air transport. |
| Hawaii | $4.20 – $5.20 | Requires ocean freight; rates vary significantly. |
🚛 Estimated Truckload Freight Rates Per Mile from Maryland to U.S. Regions (2025)
| Destination Region | Estimated Rate per Mile | Notes |
| Southeast (e.g., Florida, Georgia, Alabama) | $2.20 – $2.70 | High-volume lanes with consistent demand. |
| Northeast (e.g., New York, Massachusetts, Pennsylvania) | $2.00 – $2.50 | Short-haul routes with dense urban deliveries. |
| Midwest (e.g., Illinois, Ohio, Indiana) | $2.30 – $2.80 | Balanced demand with manufacturing freight. |
| Southwest (e.g., Texas, Arizona) | $2.50 – $3.00 | Long-haul routes with moderate demand. |
| West (e.g., California, Nevada, Washington) | $2.70 – $3.20 | Extended distances with higher fuel costs. |
| Northwest (e.g., Oregon, Idaho, Montana) | $2.80 – $3.30 | Remote areas with limited backhaul opportunities. |
| Alaska | $3.60 – $4.70 | Includes additional costs for ferry or air transport. |
| Hawaii | $4.20 – $5.20 | Requires ocean freight; rates vary significantly. |
🚛 Estimated Truckload Freight Rates Per Mile from Arizona to U.S. Regions (2025)
| Destination Region | Estimated Rate per Mile | Notes |
| Southeast (e.g., Florida, Georgia, Alabama) | $2.50 – $3.10 | Long-haul routes with limited backhaul opportunities. |
| Northeast (e.g., New York, Massachusetts, Pennsylvania) | $2.70 – $3.30 | Extended distances with urban delivery complexities. |
| Midwest (e.g., Illinois, Ohio, Indiana) | $2.40 – $2.90 | Balanced demand with manufacturing freight. |
| Southwest (e.g., Texas, New Mexico) | $2.00 – $2.50 | Short-haul routes with consistent demand. |
| West (e.g., California, Nevada, Washington) | $2.10 – $2.60 | Regional hauls with moderate demand. |
| Northwest (e.g., Oregon, Idaho, Montana) | $2.30 – $2.80 | Remote areas with limited backhaul opportunities. |
| Alaska | $3.60 – $4.70 | Includes additional costs for ferry or air transport. |
| Hawaii | $4.20 – $5.20 | Requires ocean freight; rates vary significantly. |
🚛 Estimated Truckload Freight Rates Per Mile from Oregon to U.S. Regions (2025)
| Destination Region | Estimated Rate per Mile | Notes |
| Southeast (e.g., Florida, Georgia, Alabama) | $2.60 – $3.10 | Long-haul routes with limited backhaul opportunities. |
| Northeast (e.g., New York, Massachusetts, Pennsylvania) | $2.80 – $3.30 | Extended distances with urban delivery complexities. |
| Midwest (e.g., Illinois, Ohio, Indiana) | $2.50 – $3.00 | Balanced demand with manufacturing freight. |
| Southwest (e.g., Texas, Arizona) | $2.20 – $2.70 | Short-haul routes with consistent demand. |
| West (e.g., California, Nevada, Washington) | $2.30 – $2.80 | Regional hauls with moderate demand. |
| Northwest (e.g., Idaho, Montana) | $2.40 – $2.90 | Remote areas with limited backhaul opportunities. |
| Alaska | $3.70 – $4.80 | Includes additional costs for ferry or air transport. |
| Hawaii | $4.30 – $5.30 | Requires ocean freight; rates vary significantly. |
📚 Sources
- FreightWaves — Trucking Market Trends 2025
- FTR Transportation Intelligence — Market Reports
- Project44 — April 2025 Freight Market Update
- Flexport — Global Freight Outlook
- U.S. EIA — Diesel Prices 2025
- ATA — Truck Driver Shortage Update
- Loadsmart — AI-Driven Freight Rate Tools
- C.H. Robinson — FTL Market Insights
- Uber Freight — Logistics Outlook